


I’m seeing a chart formation suggesting that a reversal from WTI crude oil’s downtrend is in the works.
How high can it go from here?
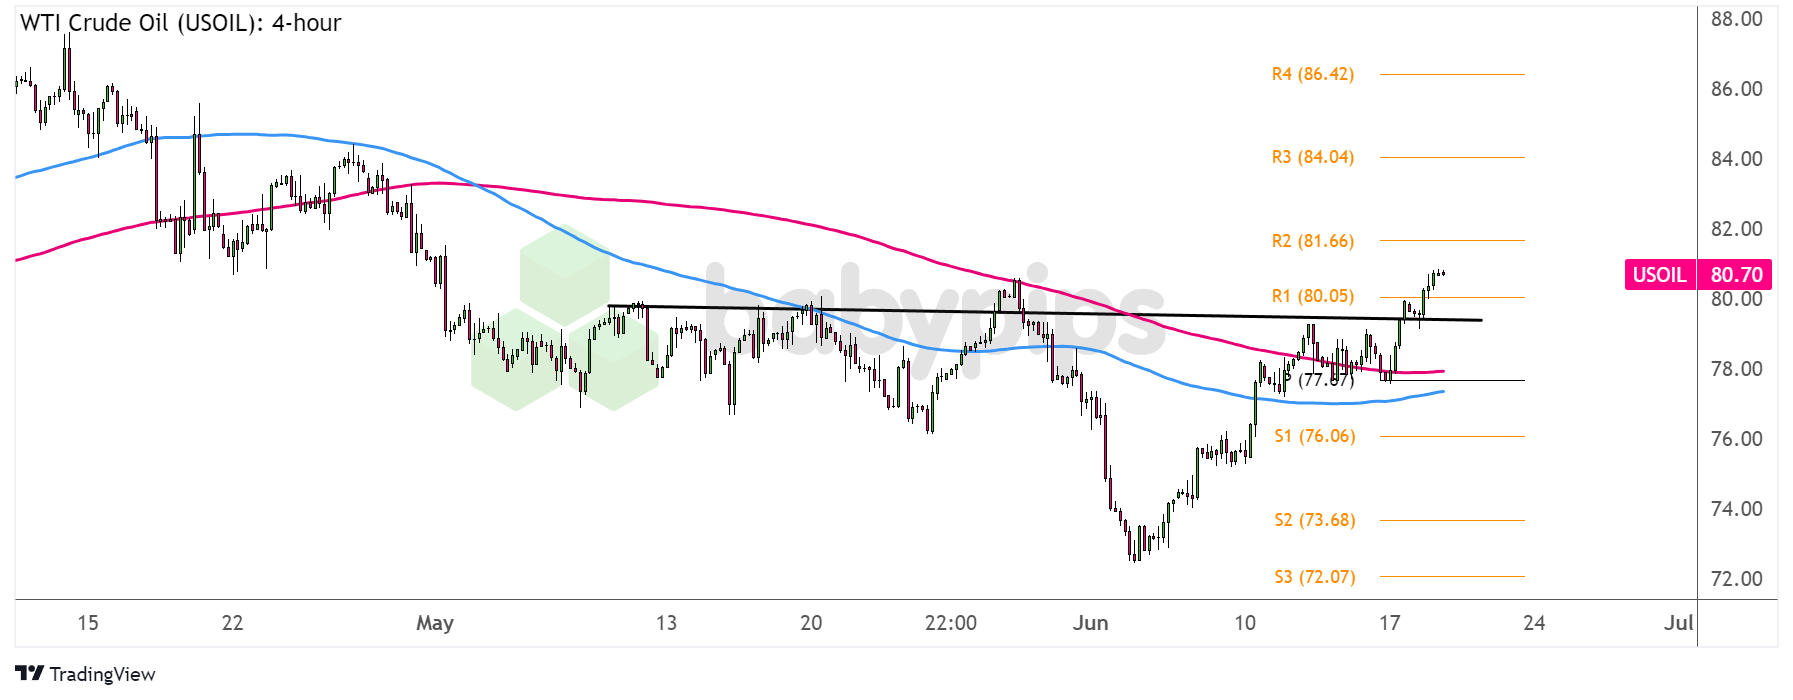
WTI Crude Oil (USOIL): 4-hour
WTI Crude Oil (USOIL) 4-hour Chart by TradingView
This energy commodity has been in selloff mode since mid-April, as the lack of market focus on geopolitical tensions likely led investors to ease up on global supply concerns.
However, WTI crude oil seemed to have hit a bottom earlier this month, staging a rally that got additional boosts from upgraded oil demand forecasts and global growth estimates.
Could this mark the end of crude oil’s slide?
Remember that directional biases and volatility conditions in market price are typically driven by fundamentals. If you haven’t yet done your fundie homework on crude oil and the U.S. dollar, then it’s time to check out the economic calendar and stay updated on daily fundamental news!The commodity price already completed what seems to be a complex inverted head and shoulders pattern on its 4-hour time frame and is closing above the neckline resistance to suggest that an uptrend may be in order.
Crude oil even busted through the dynamic inflection points at the moving averages and the $80 per barrel major psychological mark to signal that bullish momentum is gaining traction. If that’s the case, bulls could set their sights for an uptrend that’s the same height as the chart pattern.
Do note that the 100 SMA is still below the 200 SMA to suggest that there’s some bearish pressure left. Then again, the gap between the moving averages is narrowing to hint that an upward crossover might follow soon.
Think the commodity price could make it to its April highs from here?