


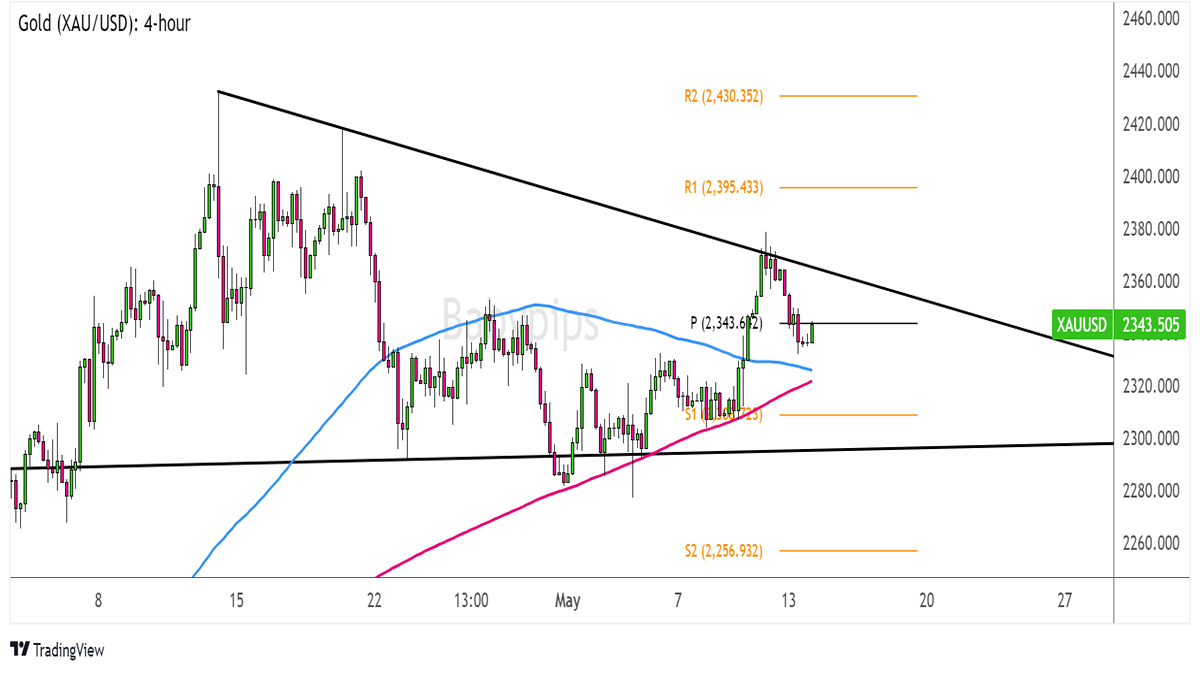
Gold is forming lower highs and finding support at $2,300, creating a descending triangle pattern on its 4-hour chart.
Is it about to dip back to the bottom soon?
Take a look at these inflection points I’m watching:
Gold (XAU/USD): 4-hour
Gold (XAU/USD) 1-hour Chart by TradingView
Gold traders seem to be playing it safe ahead of this week’s U.S. inflation updates, as the PPI and CPI figures might have a strong impact on Fed policy expectations.
After all, FOMC officials still seem to be making up their minds when it comes to picking between easing sooner rather than later or keeping interest rates higher for longer.
In their May statement, policymakers did emphasize that they are waiting for more evidence that inflation can return to target before deciding to make any adjustments.
Remember that directional biases and volatility conditions in market price are typically driven by fundamentals. If you haven’t yet done your fundie homework on gold and the U.S. dollar, then it’s time to check out the economic calendar and stay updated on daily fundamental news!Weaker than expected PPI and CPI updates might bring a fresh wave lower for the dollar, as this could underscore the “lack of progress on inflation” mentioned during the Fed decision.
If that’s the case, gold could make another attempt at breaking above the triangle top around $2,350 then set its sights on the highs near R2 ($2,430.35) or higher.
On the flip side, stronger than expected U.S. inflation data could revive talks of a pushback in Fed easing, which might drag XAU/USD back to its triangle support.
Don’t forget that the gap between the moving averages has narrowed enough to hint that a bearish crossover might happen soon.
Whichever direction you choose to trade, make sure you’re sticking to your risk management plan and that you’re keeping close tabs on any headlines that may impact gold price action!