


Bitcoin is having trouble making new highs above the $65,000 mark!
Will this lead to BTC/USD extending its weeks-long downtrend?
We’re taking a closer look at the 4-hour chart:
Bitcoin (BTC/USD): 4-hour
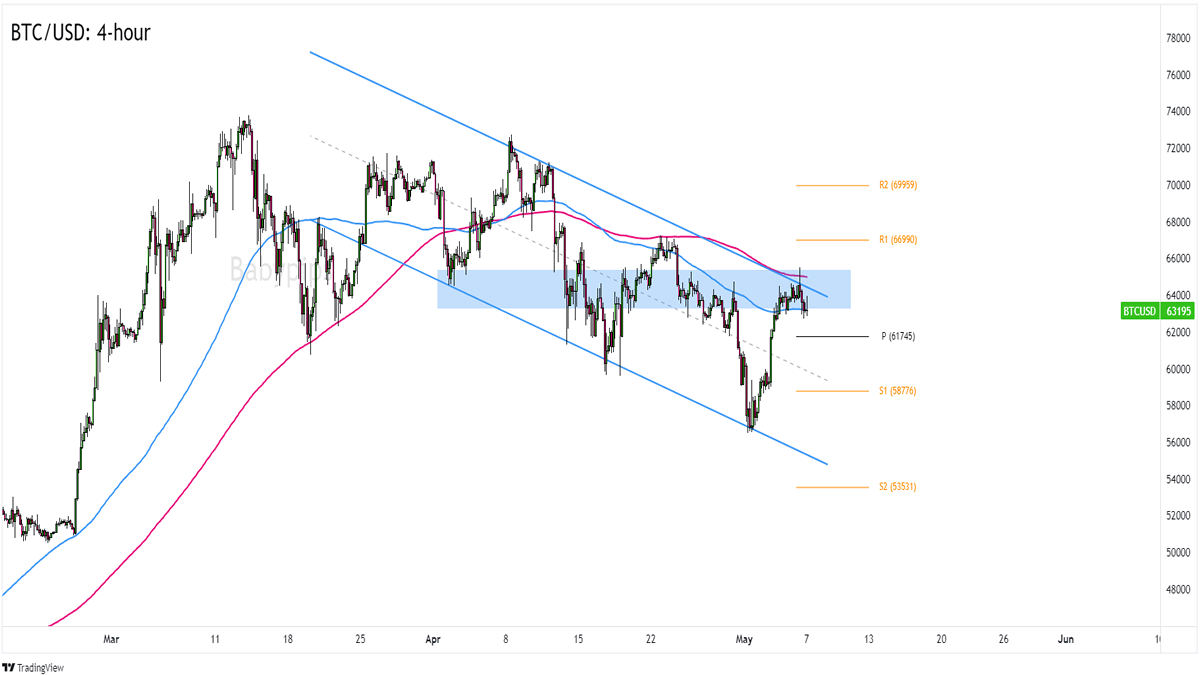
Bitcoin (BTC/USD) 4-hour Chart by TradingView
If you’ve read our latest Daily Market Recap then you’ll know that bitcoin hit a high near $65,500 before settling back down to just above the $63,000 area. While there are no direct catalysts for the move, we could be seeing an impact of spot bitcoin ETFs recording notable net outflows since last week.
Meanwhile, global growth concerns and a potential failure of cease-fire negotiations between Israel and Hamas have sent some traders to safe havens like the U.S. dollar.
Remember that directional biases and volatility conditions in market price are typically driven by fundamentals. If you haven’t yet done your fundie homework on bitcoin and the U.S. dollar, then it’s time to check out the economic calendar and stay updated on daily fundamental news!Extended bitcoin weakness could drag BTC/USD below the 100 SMA and down to the $62,000 Pivot Point level. And, if we see enough USD demand, the pair could extend its weeks-long downtrend and head for its previous lows near the S1 ($58,776) Pivot Point line or the $56,600 previous lows. Yipes!
We’re not ruling out an extension of last week’s upswing, however. If BTC/USD continues to find support from the 100 SMA area, then the pair may draw in enough buyers to revisit its $65,500 previous resistance zone. It may even break its descending channel pattern and head for the $70,000 previous inflection point!
Whichever bias you choose to trade in the next few days, make sure you’re sticking to your risk management plan and that you’re keeping close tabs on any headlines that may impact bitcoin’s price action!