


Is that a head and shoulders pattern on the 4-hour chart of AUD/USD?
Better be ready in case the pair breaks below this neckline!
Just how low do you think this Aussie pair might go?
AUD/USD: 4-hour
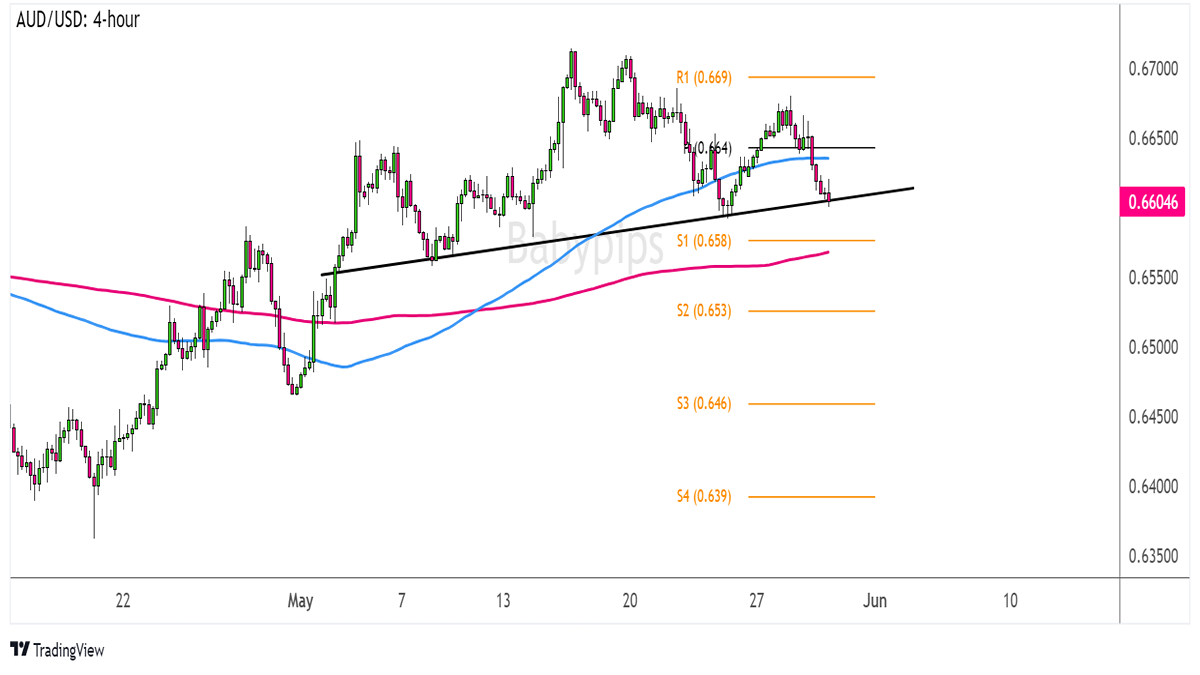
AUD/USD 4-hour Forex Chart by TradingView
The Australian dollar seems to be struggling to sustain its rally, as risk-off flows are making their way back in the markets and weighing on higher-yielding assets.
Meanwhile, the Greenback has been able to draw support from hawkish Fed rhetoric, as policymakers have recently been discussing the possibility of keeping U.S. borrowing costs higher for longer.
Does this mean that AUD/USD is in for a reversal soon?
Remember that directional biases and volatility conditions in market price are typically driven by fundamentals. If you haven’t yet done your fundie homework on the U.S. dollar and the Aussie, then it’s time to check out the economic calendar and stay updated on daily fundamental news!I’m seeing a head and shoulders pattern being completed on the pair’s 4-hour chart, and it looks like a test of the neckline support at the .6600 major psychological mark is taking place.
A break below this level could confirm that a downtrend of the same height as the formation, which spans roughly 150 pips, might follow.
The upcoming U.S. preliminary GDP release could determine which way this dollar pair is headed, so make sure you check out our Event Guide for this top-tier news event!