


AUD/CHF is having trouble picking a direction after taking a break from its uptrend.
Is it because AUD/CHF traders are ready for a bearish reversal? Or can Aussie bulls and franc bears extend a longer-term trend?
Here’s the pattern I’m looking at in the daily time frame:
AUD/CHF: Daily
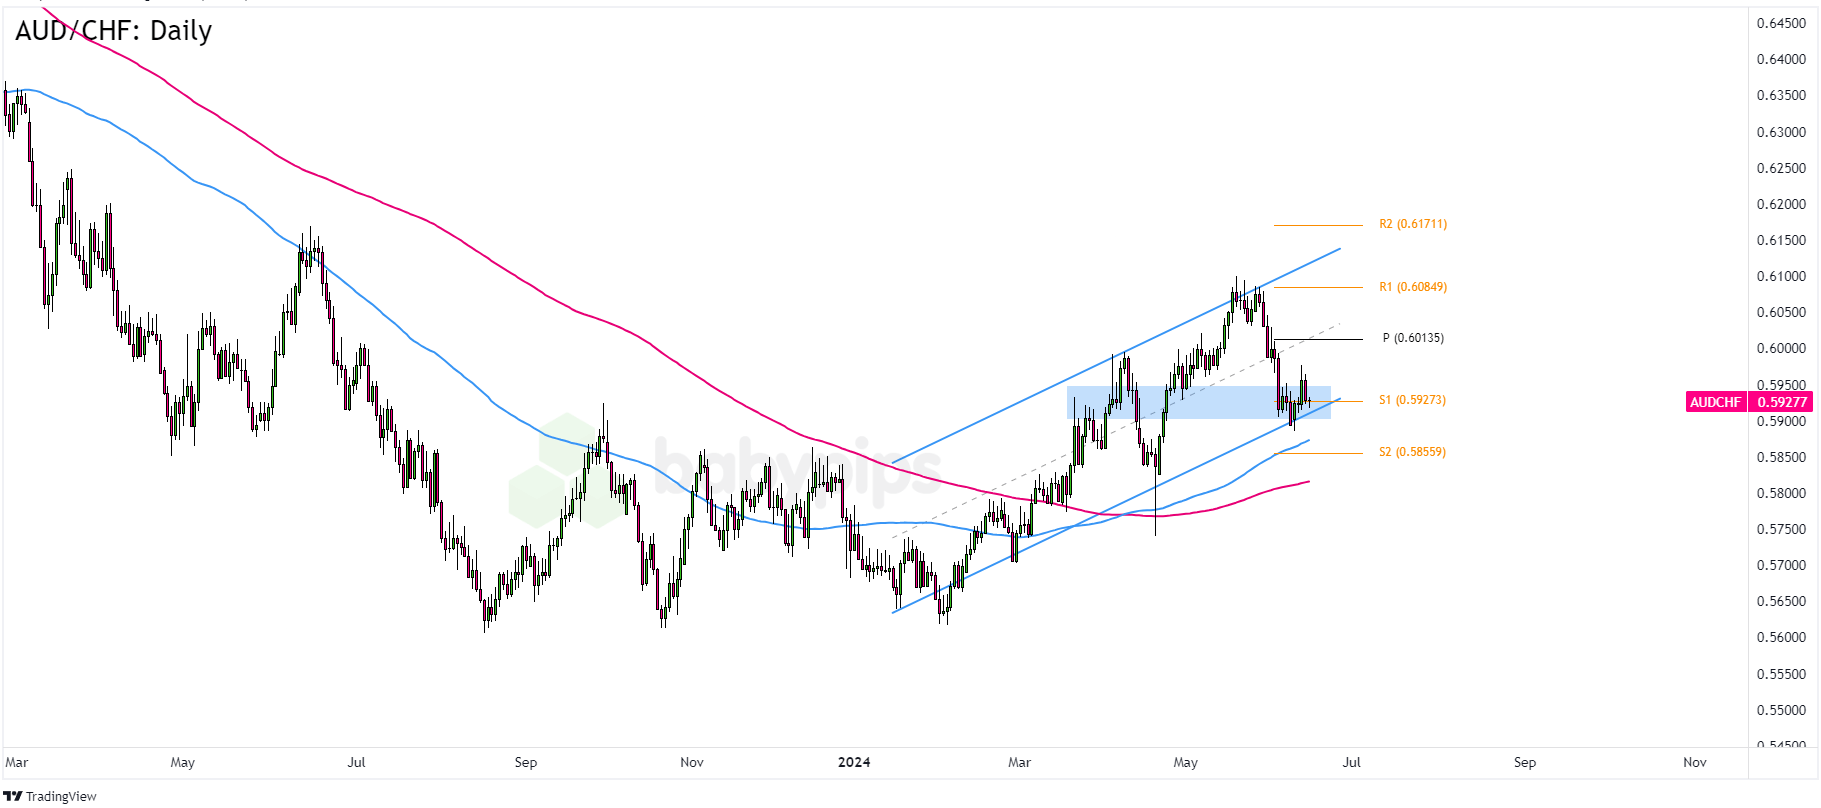
AUD/CHF Daily Forex Chart by TradingView
If you’ve been watching your Swiss franc pairs then you’ll know that the currency is struggling to find sustained demand while the Swiss National Bank (SNB) remains relatively dovish against its peers.
However, bouts of risk aversion have also boosted the safe haven’s appeal, pushing CHF higher against its “riskier” counterparts.AUD/CHF, in particular, was pulled lower from the .6085 R1 Pivot Point line all the way to the S1 (.5926) Pivot Point levels. As you can see, AUD/CHF’s current levels are also not far from the daily chart’s 100 SMA as well as an ascending channel support that’s been around since February.
Will AUD/CHF extend its uptrend?
Bullish candlesticks from the support zone increase the possibility of a return to the .6000 psychological level if not the .6085 previous highs.
On the other hand, an extension of AUD/CHF’s downswing exposes the pair to a bearish breakout.
A clear breakout, combined with red candlesticks and bearish momentum, could take AUD/CHF to lower inflection points like the S2 (.5856) Pivot Point or the .5800 previous area of interest.
What do you think? Which way will AUD/CHF go next?