


Bitcoin and its buddies are still in the red these days, sliding down to the next major areas of interest.
Will buyers step up soon?
Which altcoins are looking most bullish?
BTC/USD: Daily
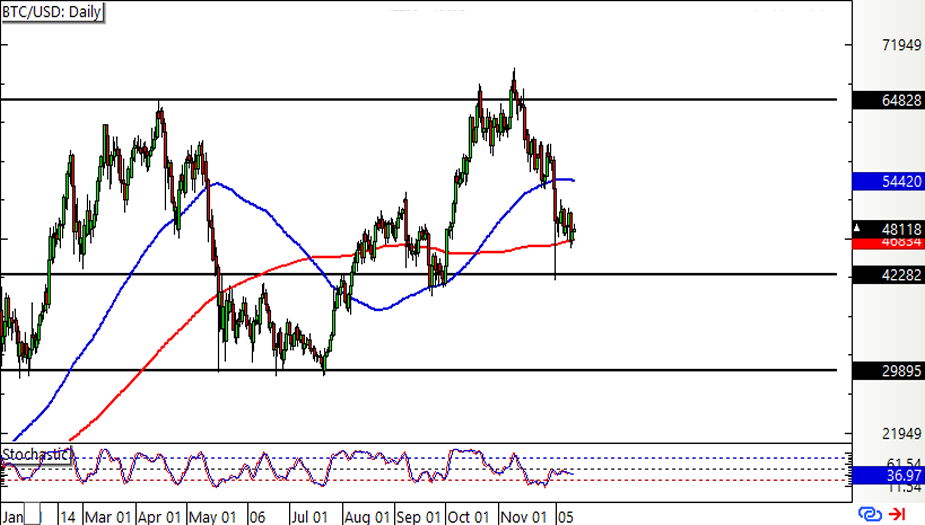
Bitcoin (BTC/USD) fell through that long-term bullish trend line we were watching last time, making its way close to the next potential floor.
Technical indicators are still hinting that there’s hope for bulls, as the 100 SMA is above the 200 SMA to reflect the presence of buying pressure.Also, the 200 SMA appears to be holding as dynamic support at the moment, hovering just above the area of interest around $43,000.
Stochastic is on the move up, so bitcoin price could follow suit while buyers have some energy left. If that’s the case, another run up to the resistance around $65,000 could follow!
ETH/USD: Daily
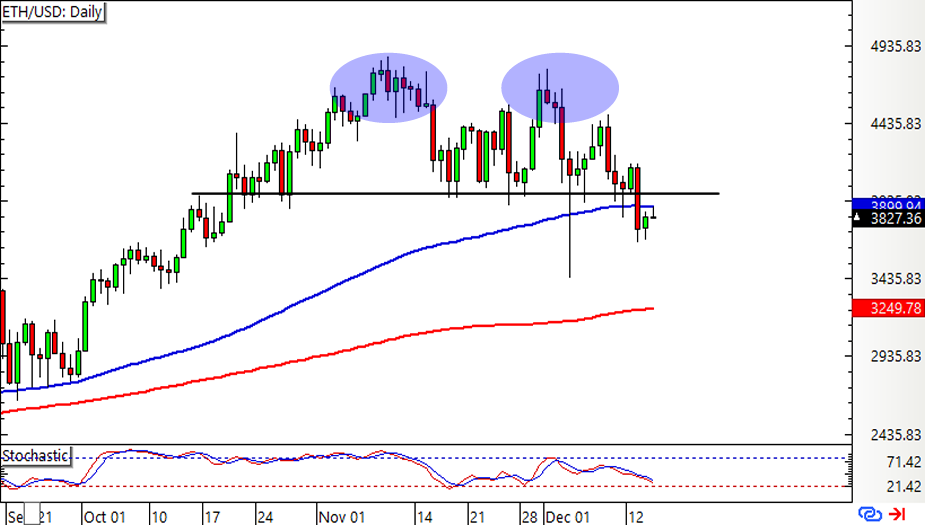
Ethereum (ETH/USD) might be in for a longer-term slide, as price just broke below the neckline of its double top pattern on the daily time frame.
At the same time, Stochastic is heading south, so price could keep following suit until oversold conditions are met. In that case, ETH could tumble by the same height as the reversal formation, which spans around $1,000.
The 100 SMA is still above the 200 SMA to suggest that there’s a chance the uptrend might resume. Besides, the gap between the indicators is widening to reflect strengthening bullish momentum.Just note that price is dipping below the 100 SMA dynamic support and might make its way down to the 200 SMA dynamic inflection point from here.
NEO/USD: Daily
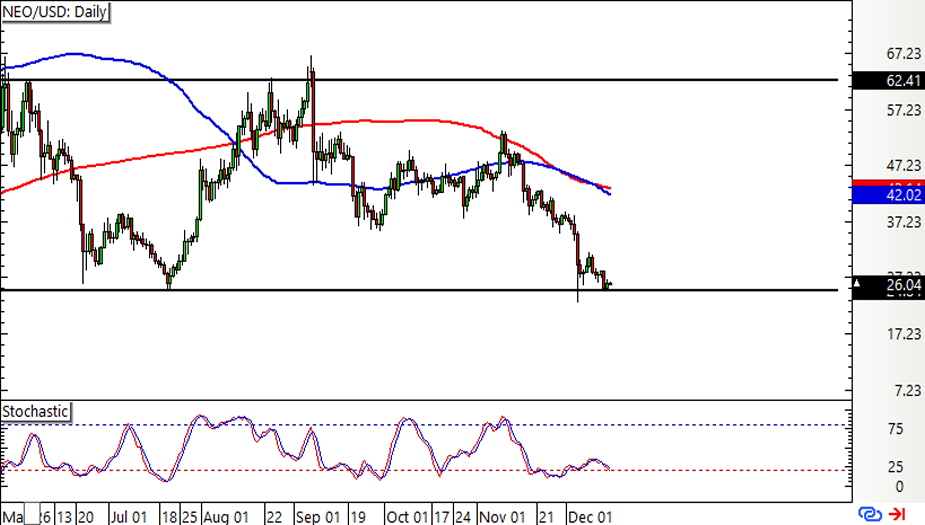
NEO/USD is sitting right at the bottom of its range visible on the daily time frame, still deciding whether to make a bounce or a break.
Technical indicators are giving mixed signals, with the 100 SMA slightly below the 200 SMA to suggest that a breakdown is likely. If that happens, price could tumble by the same height as the rectangle pattern.
However, Stochastic is pulling higher from the oversold region to indicate that buyers are taking over while sellers are exhausted. If this keeps up, NEO could recover back to the range resistance or until the area of interest at the middle.
XMR/USD: Daily
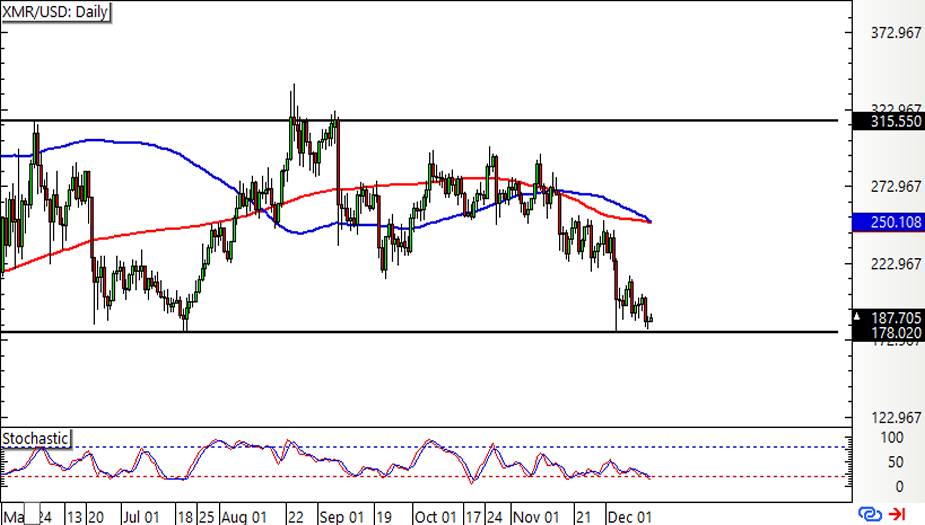
Monero (XMR/USD) is also hanging out at the bottom of its long-term range, finding support around the $180 level.
If buyers keep defending the floor, price could rally back to the resistance around $315 or until the area of interest at $250.A downside break might be in order, though, as a bearish moving average crossover seems to be taking place. If that pushes through, Monero could slide by the same size as the range pattern.
Stochastic is also heading south and has yet to reflect exhaustion among sellers, so there may be some downside momentum left in play.
Monitor the volatility of cryptocurrencies using our Crypto Volatility Meter! See which cryptocurrencies have moved the most today.
If this is your first time checking out crypto charts, keep in mind that there is a considerable amount of risk in trading cryptocurrencies due to their inherent volatility and sensitivity to headlines. Be careful out there!