


Bitcoin has broken above a short-term resistance!
Will this translate to an uptrend for the king of crypto?
Here’s a chart that I’m looking at:
BTC/USD: 1-hour
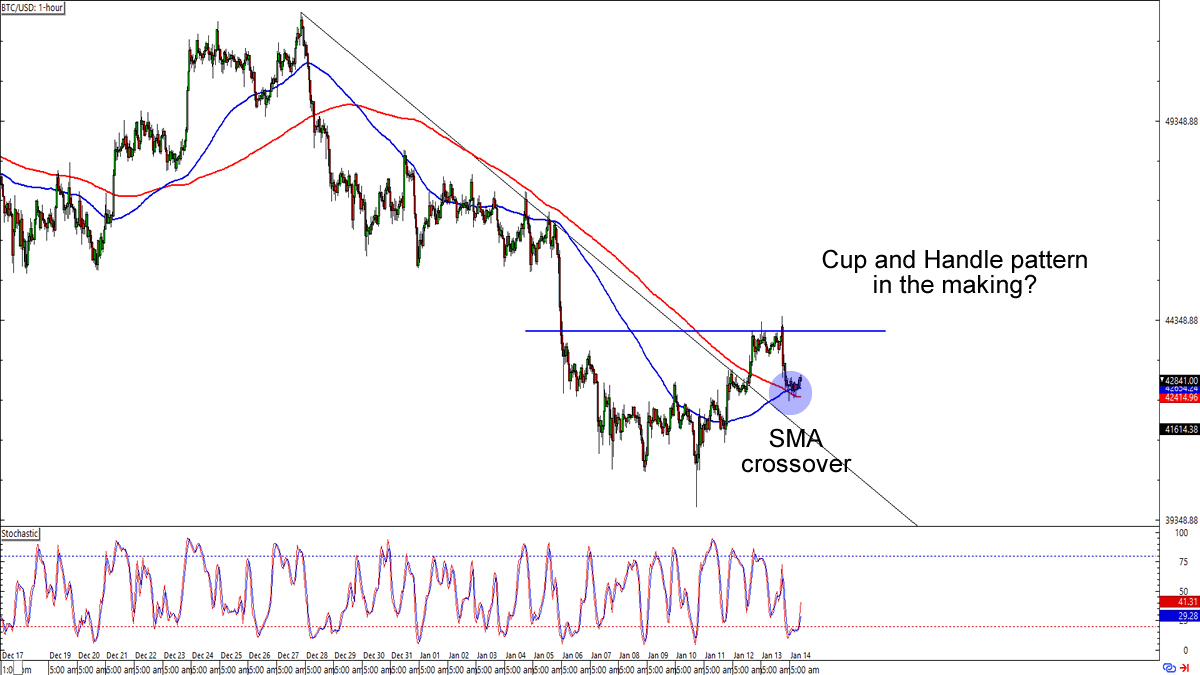
Bitcoin has been taking hits since the end of December, falling from $52,000 to $40,500 before the sellers took a chill pill.
Are Bitcoin buyers ready to step in?
BTC/USD has not only broken above a closely-watched trend line but it’s also hanging out near the broken resistance.Simple moving averages are also on the bulls’ side as the 100 SMA crosses above the 200 SMA on the 1-hour time frame.
For newbies out there, moving average crossovers often (but not always!) show up ahead of a trend change.
Look out for consistent trading above the $44,000 mark, which would not only mean new weekly highs for BTC/USD but also the upside breakout of a lowkey Cup and Handle candlestick pattern on the chart.
Bulls who are betting on a bullish reversal for BTC/USD can target inflection points like $45,600 and $47,800.
If you see BTC/USD making new weekly lows, though, then you should also prepare for a retest of January’s lows near $40,800.
This content is strictly for informational purposes only and does not constitute as investment advice. Trading any financial market involves risk. Please read our Risk Disclosure to make sure you understand the risks involved.