


Bitcoin is sitting right on the bottom of its short-term range, waiting for bulls to defend the floor.
Will it hold again this time?
BTC/USD: 1-hour
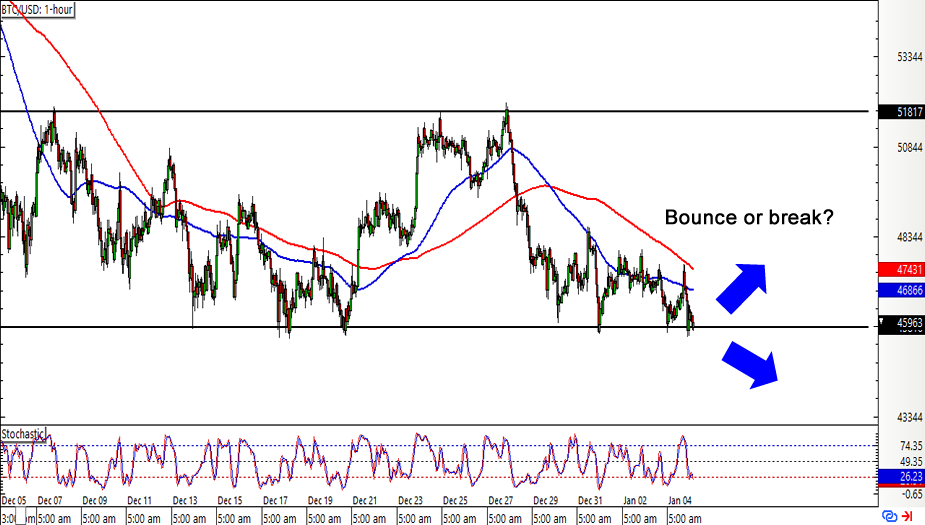
Bitcoin has been off to a shaky start for the year, as it hovered around the bottom of its month-long trading range and formed lower highs.
Could this mean that sellers are warming up for a break lower?
Technical indicators seem to be pointing to more losses for this one, as the 100 SMA is below the 200 SMA while Stochastic has room to move south.
In other words, bearish momentum is in play and could stay on until oversold conditions are met.There could still be some hope for bulls, though, since the gap between the moving averages is narrowing to reflect slowing selling pressure. Also, the oscillator looks pretty close to indicating exhaustion among bitcoin bears.
Should you buy or sell bitcoin?
If the range support holds, BTC/USD could recover to the top of the range near $52,000 or at least until the area of interest at the middle.
Better keep your eyes peeled for reversal or breakout candlesticks if you’re planning on trading this one!
This content is strictly for informational purposes only and does not constitute as investment advice. Trading any financial market involves risk. Please read our Risk Disclosure to make sure you understand the risks involved.